
ANNEX 3 : STATISTICS
The Impact of Divorce Law Practice on Fathers and ChildrenSupplement : Summary, Probabilities and Extrapolations, and Conclusions
CONTENTS
|
1.1 Background 1.2 Methods 1.3 Presentation of Results 2.1 Number of Responses to Questionnaire 2.2 Age of Respondents in Years 2.3 Marriage 2.4 Duration of Marriage 2.5 Age at Start of Divorce Proceedings 2.6 Children 2.7 Age of Children at Start of Divorce Proceedings 2.8 Occupations 3.1 Grounds for Divorce 3.2 Time to Get Divorced 3.3 Defence of Divorce 4.1 Child Custody 4.2 Child Contact 4.3 Legal Proceedings |
5.1 Capital 5.2 Maintenance 5.3 Legal Costs 5.4 Total Financial Impact 5.5 Home 6.1 Legal Aid 6.2 Malpractices 6.3 Court Welfare Officers 6.4 Women Above the Law 7.1 Health and Career 7.2 Subsequent Attitudes 7.3 Remarriage
|
1.1 Background
This survey was undertaken by The Cheltenham Group (CG) for Families Need Fathers (FNF). CG undertook the construction, printing and analysis of the questionnaire and FNF undertook the distribution and collection of them.
The aim was to establish the impact of current divorce law practice on fathers and their children. In particular we wished to create some objective data to back up the anecdotal evidence produced from :
the FNF ‘walk-in-talk-in’ sessions or branch meetings (about 20 locations nationally),
and from reports about individual cases made to local contacts throughout the country (about 50).
The evidence concerned the types of problems experienced, their severity and their causes.
These data may be viewed as representative of FNF members but not necessarily of divorced men in general. This is obviously because FNF members are, by definition, men who are experiencing difficulties regarding their children. However it should also be borne in mind that there may be many men who, for one reason or another, experience similar or worse problems yet fail to join FNF. CG have certainly encountered such cases where, for example, either the man has suffered so badly that he just withdraws from the scene altogether, or does not feel he can share his experiences in public and fights his own private battle. It is known from FNF local contacts, who usually receive the first phone call from a man with difficulties, that only approximately 1 in 10 such callers subsequently join FNF. The men usually contact FNF when they are already enmeshed in the system and are finding that the system does not protect them and their children.
Apart from representativeness, there is the problem of truth. We would argue that the data are likely to be true because a respondent has nothing to gain by lying and some respondents have freely acknowledged fault on their part in relation to some issues.
CG would urge that people wishing to use these data for publicity or campaigning purposes, guard against their being dismissed as unrepresentative or untrue by presenting them as merely part of the pattern of evidence that may be brought to bear on the matter. This may be supplemented by Government statistics, by other evidence in the literature, and by evidence of the principles that the courts operate with.
For example, the fact that the courts have done away with fault and conduct (in the matrimonial obligations sense) and opted for the unconditional protection of the "weaker spouse" (i.e. the wife) is public knowledge. These data may therefore be used by those responsible for implementing these principles, e.g. Parliament, to understand the human consequences of them.
1.2 Methods
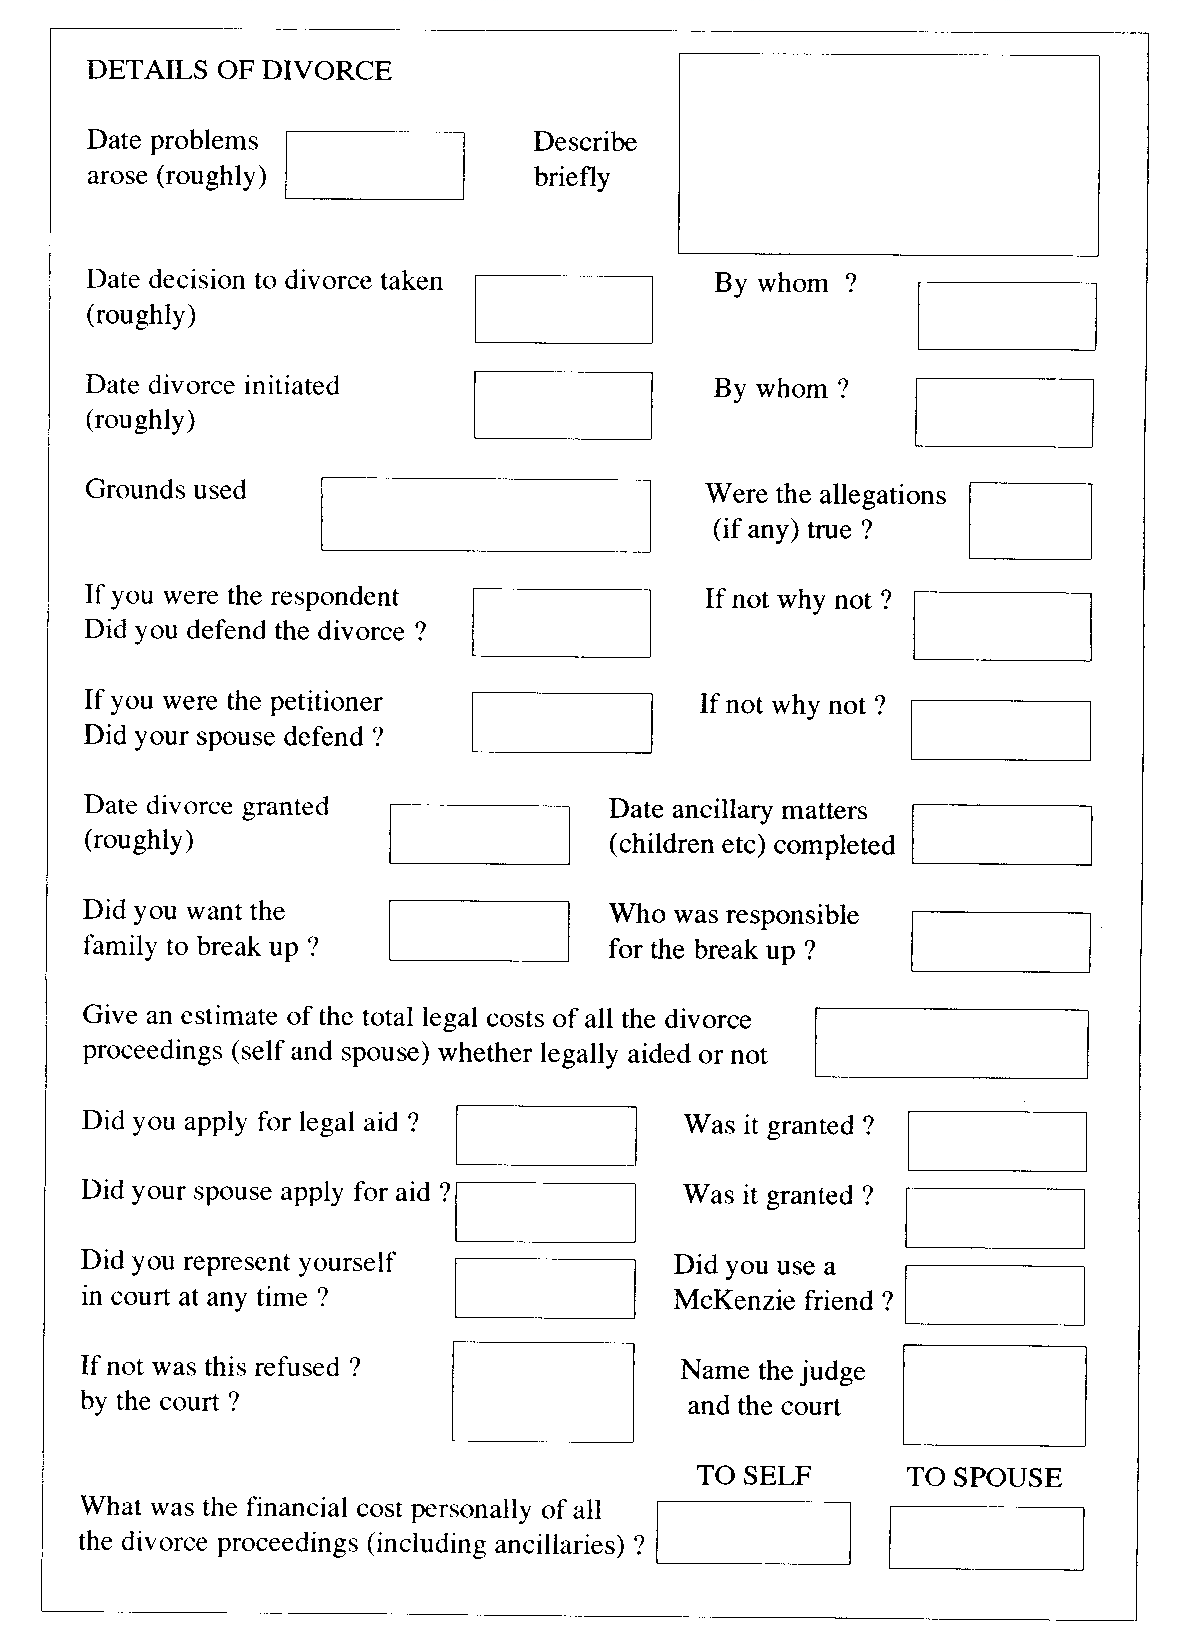
The questionnaire structure is shown at Annex A. It was designed to cover as full a range of issues as possible whilst not being too onerous a task to complete. It was also designed to produce minimum constraint on responses so that the questionnaire could be kept to a reasonable size whilst ensuring that all respondents could answer in the way they felt necessary.
The costs incurred with this strategy were that some responses were not usable and a heavier burden was placed on the analyst to construct categories post hoc. It was necessary to suffer these costs, however, because otherwise a significant pilot run of the questionnaire would have been necessary. Time and resources did not permit this.
A draft questionnaire was constructed and trialled on four FNF members and one independent (non-divorced) person. The final questionnaire was constructed on the basis of this feedback. The questionnaire consisted of two parts - a set of questions and responses which produced statistical data and a free text narrative which was used to construct a large part of the "dossier" of case studies to be incorporated into a book. Only the statistical data are reported here.
A copy of the questionnaire, together with an addressed return envelope, was sent to every FNF member - that is to about 2,000 people - during July 1995. Returns were received from 347 respondents. These included one woman who was excluded from subsequent analysis. Some question responses were left blank or were unusable. Where this is the case it is indicated in the appropriate section. The number of responses upon which each analysis is based is given in each section.
Reports about individual cases are available for further investigation by serious enquirers. A researcher interested in studying a case, or obtaining the narrative data, should apply to either FNF or CG. Complete anonymity of respondents, however, will be preserved, and release of names will be subject to the permission of the individuals.
The data were analysed on a PC using a ClarisWorks spreadsheet. The raw data are not reported here but any individual wanting access to the database should apply to FNF or CG.
1.3 Presentation of Results
It should be noted that within each topic, the results are presented from those respondents who could, and did, respond to questions on that topic. For example, out of the 346 respondents available for analysis, 307 are known to have married, of which 299 married in church or registry : data for divorce are, and can only be, presented from those 307 respondents. Each topic is therefore introduced with the number of responses which could be, and are, available for that topic. The charts show the number of respondents in each category, unless stated otherwise. The charts include numbers for ‘no information’ where this is useful to relate to the total numbers which could be available for that topic.
For each topic, information is presented as follows :
number of responses - i.e. those relevant to that topic and actually available
results - in text and more usually in calibrated chart form
quotations - of typical remarks made by respondents
comments - which highlight the major aspects and some inferences.
It may be noticed that some data appear inconsistent with other data. For instance the time to decree absolute was given by 340 respondents, while only 307 were declared to have married. It is clear that, as with all questionnaires, that some respondents had difficulty in responding in an unambiguous way e.g. in this topic, some respondents may have married twice, and other may have given the date of cohabiting separation. Despite this, the overall figures have much consistency within themselves and with Government statistics.
The terms ‘custody and contact’ are used, rather than ‘custody and access’ or ‘residence and contact’, on the basis that they better reflect the reality of these issues.
2.1 Number of Responses to Questionnaire
There were 346 responses from men entered into the analysis. The single woman who responded was omitted from the analysis.
Note that in the sections which follow, where appropriate, we introduce each topic with the number of relevant and available responses.
2.2 Age of Respondents in Years
The age of the respondents at the time of the survey is given in Figure 2.2.

Figure 2.2 : Age of respondents (in years)
2.3 Marriage
Number of responses : 341 gave information and 5 gave no information.
Results : a total of 299 were married in church or registry. Another 3 indicated ‘other religions’ and for another 5 ‘no information’ was available : a maximum of 307 were therefore married. The remaining respondents, i.e. 39, stated they had been cohabiting. Marital status and place of marriage ceremony are given in Figure 2.3.

Figure 2.3 : Marital status and place of marriage ceremony
Comment : most respondents, i.e. 86.4%, were married in church or registry office.
2.4 Duration of Marriage
Number of responses : those who reported the dates of marriage and divorce numbered :
- 285 for those reporting the date of start of divorce proceedings
- 242 for those reporting the date of decree absolute.
Results : are available for the duration of the marriage in years, from marriage to :
- the start of divorce proceedings, and
- the decree absolute
are given in Figure 2.4.

Figure 2.4 : Duration of the marriage (in years)
Comments : marriages in the survey were long term commitments, with an average of about 10 years up to about 30 years. The difference in the durations i.e. from start of divorce proceedings to decree absolute also gives data for the time taken to divorce. Based on the median this is 1.63 years, and based on the average this is 1.53 years.
2.5 Age at Start of Divorce Proceedings
Number of responses : there were 292 responses from which this data could be obtained.
Results : are given in Figure 2.5.

Figure 2.5 : Age at start of divorce proceedings (in years)
Comments : the median of nearly 40 years, with a small standard deviation of less than 7, shows that the ages close to 40 years are a dangerous time for a man in a marriage.
2.6 Children
The modal number of children is 2, the average number is 2.06, and the range is from 1 to 7.
2.7 Age of Children at Start of Divorce Proceedings
Number of responses : there were 541 children of respondents for whom this data could be obtained.
Results : are given in Figure 2.7. There were 4 reported cases of ages close to 0, indicating that cases are occurring close to, or before, the birth of children.

Figure 2.7 : Age of children at start of divorce proceedings (in years)
Comments : as the average age was close to 7, with a standard deviation of over 4, it is clear that most ages of children occurred, from babies to teenagers. The popular belief that difficult periods are after the birth of children, and after children have left home, are not supported by these results.
2.8 Occupations
There is a large range of occupations in the respondents. The majority are ‘middle class’ occupations, and within that broad observation, the range of occupations appear similar to the population as a whole. No particular group is identified as more prone to divorce.
Insufficient information was available to assign respondents to standard socio-economic categories, so occupations alone are given with numbers in Annex B.
3.1 Grounds for Divorce
Number of respondents :
the petitioner was identified (as husband/wife/both) in 295 cases
the grounds used were given in 282 cases
the grounds used, and whether these were denied or not, were given in 252 cases.
These figures may be compared with 299 respondents who were married in church or registry, and a total of 307 known to have married.
Results : with regard to the splitting up of the family, all men who commented said they did not want to split from their children. Also :
308 respondents, including those from a cohabiting couple, said they had not wanted the family to split up
a further 22 thought that splitting from the spouse inevitable, but hadn’t wanted to split from their children.
The major results are given with respect to :
those who petitioned are shown in Figure 3.1a
grounds used are shown in Figure 3.1b
grounds used against men and women (and numbers who denied) are shown in Figure 3.1c.

Figure 3.1a : Those who petitioned

Figure 3.1b : Grounds used

Figure 3.1c : Grounds used against men and women (and numbers who denied)
Comments : approximately 3 times as many women petitioned for divorce as men. The unreasonable behaviour grounds were used in more than two-thirds of cases. Most men denied the allegations, although few women denied them, as reported by the man responding. An interpretation of the data for grounds and denial is that it was unnecessary for women to deny, while men found it necessary in order to defend themselves.
3.2 Time to Get Divorced
Number of responses : it is noted that some respondents would not have completed all proceedings in their cases when the survey was conducted, however information on time taken is given :
the time to decree absolute was given in 232 cases
the time to settle ancillaries was given in 186 cases
there were 57 cases reported which settled ancillaries some time after the decree absolute.
Results : the time to process the divorce and financial matters is shown in the combined chart of Figure 3.2a. Some cases took greater time, and the time to settle these after the decree absolute is given in Figure 3.2b. The vertical scale on Figures 3.2a and 3.2b is number of cases

Figure 3.2a : Time to decree absolute & to settle ancillaries

Figure 3.2b : Time to settle after decree absolute
Comments : the chart shows that typical times to complete a divorce and associated financial issues is between 1 and 2 years. This is supported by the data in 2.4 above for the duration of marriages, which distinguishes between time to start of divorce proceedings and time to decree absolute. The differences are 1.44 years based on medians, and 1.53 years based on averages.
3.3 Defence of Divorce
Number of responses : in response to whether the divorce was defended, 231 men stated whether they decided to defend or not. Of those who did not defend, 153 gave reasons for this.
Results : the proportion of those defending, not defending and cross petitioning is given in Figure 3.3a. Of those who gave reasons for not defending, the reasons given are analysed in Figure 3.3b.

Figure 3.3a : Defending, not defending and cross petitioning

Figure 3.3b : Reasons not defended
Quotes : concerning the reasons for not defending a petition, the following comments were typical :
Solicitors’ advice was ‘No chance of winning’, ‘Too expensive’
Couldn’t on legal aid and persuaded not to by solicitor
The bloody solicitor advised me not to defend
Comments : the vast majority of divorces were undefended, and a large proportion were undefended because of the solicitor’s advice. This has occurred despite most men denying the allegations made.
4.1 Child Custody
Number of responses : most respondents gave information about custody and legal proceedings, and so the figures are given out of 346. There are 29 men with custody, for which some analysis of the gender of the children may be made.
Results : are given for the numbers contesting custody and for the resulting situation :
contested custody and the results are given in Figure 4.1a
resulting situation on custody is given in Figure 4.1b
men with custody - gender of children is given in Figure 4.1c
men with custody or shared custody - how achieved is given in Figure 4.1d.

Figure 4.1a : Contested custody and the results

Figure 4.1b : Resulting situation on custody

Figure 4.1c : Men with custody - gender of children

Figure 4.1d : Men with custody or shared custody - how achieved
Quotes : among the common comments from fathers :
I was not given a chance to state a case for equal parenting.
I didn’t have a job or home. Lost it when she left me.
Couldn’t afford to initially, because had to re-house myself.
Advised against. Also access was agreed at that time [- never sees children now]
Advised by solicitor that ‘fathers hardly ever get custody. Better to save the money’.
Children already alienated. Couldn’t even get contact.
Told not to rock the boat.
My solicitor convinced me that I would not get residency because they were young girls.
Ex’s barrister said that it is irregular to ask for more than 2 weekends [contact] a month.
‘A man living on his own is not respectable.’ [- said by Judge who subsequently gave no contact]
Comments : many men do not contest custody, and are discouraged to. Those that do succeed in few cases. Those men who achieved custody were more likely to obtain this by agreement than by court order.
4.2 Child Contact
Number of responses : most respondents gave information about child contact. Information about specific contact issues was given by :
328 men gave information about obstructed contact
204 gave information about their actual contact
270 commented on the attitude or behaviour of the custodial parent i.e. the mother.
Results : 269 men reported damage to the relationship with their children. Results are given for :
obstruction of contact in Figure 4.2a
actual contact in Figure 4.2b
attitude of custodial parent (i.e. the mother) in Figure 4.2c
behaviour of custodial parent (i.e. the mother) in Figure 4.2d.

Figure 4.2a : Obstruction of contact

Figure 4.2b : Actual contact

Figure 4.2c : Attitude of custodial parent (i.e. the mother)

Figure 4.2d : Behaviour of custodial parent (i.e. the mother)
Quotes : typical of these were :
- Have travelled 450 miles round trip and been denied pre-arranged contact on arrival.
- [Children] told I was "the bad guy".
- ‘Power of control’ by spouse. I have to accept her decisions. [- now his child thinks it is his decision to restrict times he sees her]
- If you see HIM we are finished. [- said to children by their mother]
- She [i.e. the mother] disappeared [- children never seen since]
- She made it emotionally impossible for the children to visit. [- no contact for 10 years]
- She doesn’t give me details of where she is now and doesn’t want me to see my son just to pay for him.
Comments : most respondents reported deliberate obstruction to contact, and a significant number were prepared to go to extreme behaviour to alienate the father. Out of all 346 respondents, 27.9% had lost all contact with their children, and 30.6% reported the mother as being in contempt of a court order. No reports of mothers being prosecuted for contempt of court were made.
4.3 Legal Proceedings
Number of responses : reports about legal action taken over contact with children were given in 178 cases.
Results : the number of times legal action was taken over contact, and by how many respondents, is given in Figure 4.3.

Figure 4.3 : Legal action taken over contact
Comments : Despite deliberate obstruction of contact, a significant proportion, about one-half, had taken no legal action over contact.
5.1 Capital
Number of responses : Only cases of married respondents, of which 307 are known, were used for the analysis of asset distribution, of these :
245 responses covered money brought into the marriage
187 responses covered distribution of assets.
Results : the distribution of capital assets is given under the heads :
money brought into the marriage by men and women is given in Figure 5.1a
distribution of assets to men and women is given is given in Figure 5.1b
distribution of assets as percentage of capital to men and women is given in Figure 5.1c.

Figure 5.1a : Money brought into the marriage by men and women (in £s)

Figure 5.1b : Distribution of assets to men and women (in £s)

Figure 5.1c : Distribution of assets as percentage of capital to men and women
Quotes : words used to describe the impact :
ruined, phenomenal, devastating, incalculable, catastrophic, disastrous, etc
Other quotes from men include :
Even when children live with the man, woman can still get larger share of the assets.
My solicitor advises ‘she has wiped you out’.
Comments : men brought more assets into the family at marriage, and women left with more assets at divorce, in each case by a factor of about 5. Women as a group received about four fifths of the family assets in total after divorce. Typical cost to the family of divorce is several tens of thousands of pounds.
5.2 Maintenance
Number of responses : respondents were paying maintenance :
for ex-wife in 41 cases and for children in 185 cases
earnings were reported by 306 respondents, and of these, the maintenance, of any sort, is known in 200 cases, allowing the proportion of maintenance to income to be known for these 200 cases
whether full payments were being made was given in 322 cases.
Results : the data shows :
percentage of all cases who pay maintenance to children, and percentage of those previously married who pay maintenance to ex-wife, is given in Figure 5.2a
maintenance paid per month (£s) is given in Figure 5.2b
earnings (£s) of men and women are given in Figure 5.2c
proportion of maintenance to earnings is given in Figure 5.2d
numbers who make full payments are given in Figure 5.2e.

Figure 5.2a : Percentage of all cases who pay maintenance to children, and percentage of those previously married who pay maintenance to ex-wife

Figure 5.2b : Maintenance paid per month (£s)

Figure 5.2c : Earnings (£s) of men and women

Figure 5.2d : Proportion of maintenance to earnings

Figure 5.2e : Numbers who make full payments
Comments : most maintenance is for children, although when women do receive maintenance, it is about 50% more than that for 1 or more children. Most men provide maintenance for their children, even when they have been divorced and dispossessed of their life savings.
5.3 Legal Costs
Number of responses : for legal costs the data is based on :
225 responses covered legal costs of all proceedings for men only
216 responses covered legal costs of divorce only for both parties.
Results : the legal costs of all proceedings for men only, and of divorce only for both parties are given in Figure 5.3.

Figure 5.3 : Legal costs of all proceedings for men only, and of divorce only for both parties
Comments : legal costs for divorce and other proceedings are typically measured in tens of thousands of pounds, which is obtained from family assets.
5.4 Total Financial Impact
Number of responses : 133 responses covered total financial impact.
Results : total financial impact is given in Figure 5.4.

Figure 5.4 : Total financial impact (in £s)
Quotes : include :
Total impoverishment.
Ruination. Lost everything.
Complete destruction of myself.
So far everything I have worked and studied for, for 20 years.
Comments : the median of lost assets was about £50,000, and the range extended up to about £1,000,000.
5.5 Home
Number of responses : the number of responses indicating :
who left the home, and by what means, is 306
whether the home was sold, and who stayed, is 288.
Results : the allocation of the home is shown by :
who left the home, and by what means, in Figure 5.5a
whether the house was sold, in Figure 5.5b
who stayed, when home not sold, in Figure 5.5c.

Figure 5.5a : Who left the home, and by what means

Figure 5.5b : Whether the home was sold

Figure 5.5c : Who stayed, when home not sold
Comments : in nearly half of all cases, the family home was sold. While more men left the home, much more often by court order, those men who stayed in the home were more likely to keep that home than sell it. Women given the home ‘in the interests of the children’s stability’, often sold the home and moved on. In many cases the woman leaves with the children.
6.1 Legal aid
Number of responses : the number of applications for legal aid was :
166 men
255 women.
Results : are shown in :
number who applied for legal aid, in Figure 6.1a
percentages of those applying for legal aid who obtained, in Figure 6.1b.
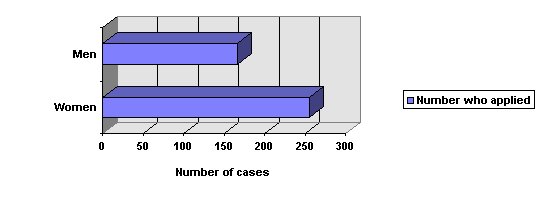
Figure 6.1a : Number who applied for legal aid

Figure 6.1b : Percentages of those applying for legal aid who obtained
Comments : women are approximately twice as likely as men to obtain legal aid, and so be able to afford solicitors and barristers.
6.2 Malpractices
Number of responses : most men, of the total of 346 respondents, commented on malpractices in the legal system. The questionnaire did not include as much analysis of this area as the authors would now wish.
Results : are given in Figure 6.2. The information available is given for :
any reported malpractice,
and then separately for malpractices of :
solicitors,
barristers,
court welfare officers (CWOs),
judges,
‘court’/’the system’,
the Child Support Agency (CSA).
Some respondents reported more than one area of malpractice, therefore the total number of reports about malpractices is greater than the total number of respondents.
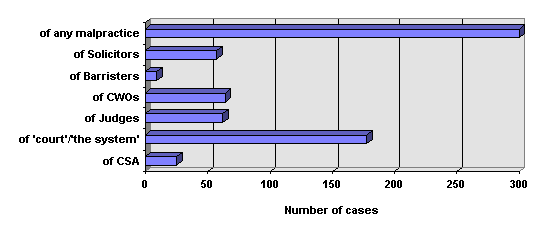
Figure 6.2 : Malpractices in the legal system
Comments : the malpractices are regularly reported in anecdotal evidence. These figures illustrate the scale of the problem. Many men progress their case with an inadequate knowledge of the legal system, often relying on lawyers. They hence are not aware of what should have happened in the case, and so are not in a position to report the malpractices in their case.
6.3 Court Welfare Officers
Number of responses : responses were given about Court Welfare Officers (CWOs):
193 responses about the gender of CWOs
186 responses stated whether the CWO met the father with his children
169 responses stated their opinion on whether the report was fair or unfair
158 responses stated whether the judge accepted the CWO’s recommendation.
Results : results are given for :
gender of CWOs is given in Figure 6.3a
whether CWO met father with his children is given in Figure 6.3b
opinions on whether report was fair or unfair is given in Figure 6.3c
whether judge accepted CWO’s recommendation (whether fair or not) is given in Figure 6.3d.
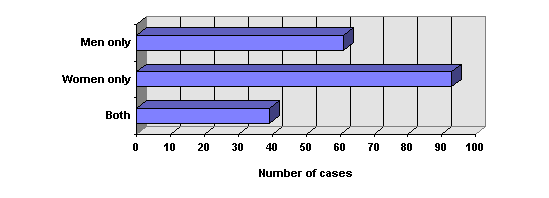
Figure 6.3a : Gender of CWOs
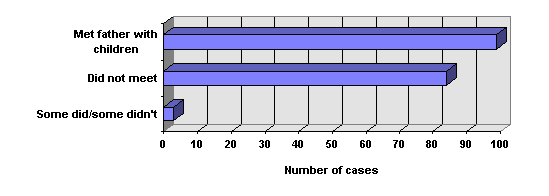
Figure 6.3b : Whether CWO met father with his children
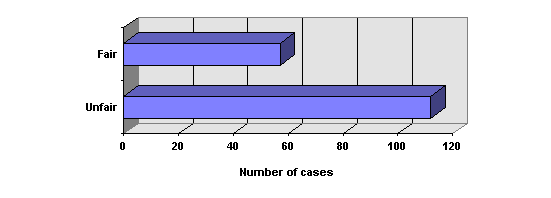
Figure 6.3c : Opinions on whether report was fair or unfair
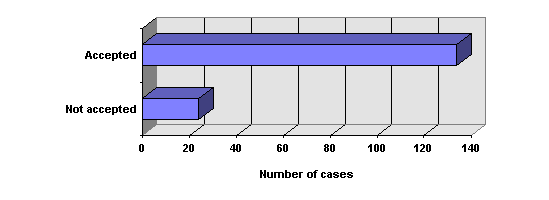
Figure 6.3d : Whether judge accepted CWO’s recommendation (whether fair or not)
Quotes : with respect to CWOs, typical comments are :
She met ex-wife, other man, children, NOT me.
Feel DCWO (female) was biased towards spouse as she concluded in her report that my role in my daughter’s future was unimportant.
With respect to CWO reports :
The judge was most influenced by a damning CWO report which I was advised I could not see.
Sat in court, did not see report.
Judge believed children better with mother despite welfare reports saying children do equally well with me. [Subsequently had no contact]
Comments : there is immense bias in CWO reports, and most are considered to be unfair. It is very unusual for a judge not to accept a CWO’s recommendations.
6.4 Women above the Law
Number of responses : responses were given about :
false accusations, made by women against men, in 324 cases
whether or not there was compliance with contact court orders in 138 cases.
Results : results are given for :
false accusations made by women against men, in Figure 6.4a
compliance by women with contact orders, in Figure 6.4b.
The most common false accusations were financial misconduct, violence and abuse to spouse or children.
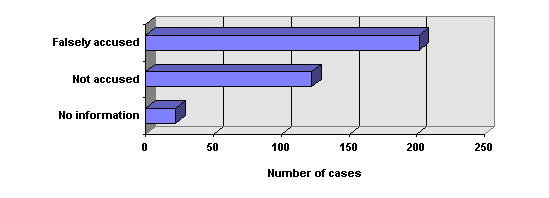
Figure 6.4a : False accusations made by women against men
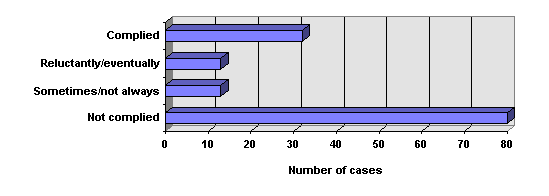
Figure 6.4b : Compliance by women with contact orders
Quotes : With respect to court activities and non-compliance with court orders :
Lots of Court Orders but no success. [- hasn’t seen children for 2 years]
Opposed contact throughout, failed to deliver children as ordered. Totally uncooperative.
I applied for Contact Order. No order was made ‘in the interests of the children’.
[Father’s relationship with children - ] Destroyed by mother’s defiance of Court Orders.
Contact Order was made but now not complied with. [- this father is a solicitor]
No. [Answer by ex-wife to question re. compliance with Court Order, despite being warned in contempt]
Contact Order ignored by mother. Court refused to enforce.
I didn’t see my daughter at all because of the mother’s flouting of a Court Order.
‘Mothers are never sent to prison’. [- said by ex’s barrister, when a father had applied for a penal endorsement because his access was being denied]
With respect to false accusations :
Lies and damned lies by ex. and her solicitor. Own solicitor biased.
Comments : women frequently do not comply with court orders, twice as often as they comply, and yet no action is taken against them. Women are placed above the law, as perjury and contempt of court by women are largely condoned by the courts.
7.1 Health and Career
Number of responses : reports of stress, health and career problems were available from 287 cases, which is most of the respondents.
Results : the levels of problem are :
stress at separation from children, or denied contact
extreme stress, e.g. weight loss, sleeplessness, lack of concentration at work, having to have time off, etc.
clinical stress, e.g. losing job, having to consult doctor, psychiatrist for both physical and mental illness.
These problems are shown in Figure 7.1.
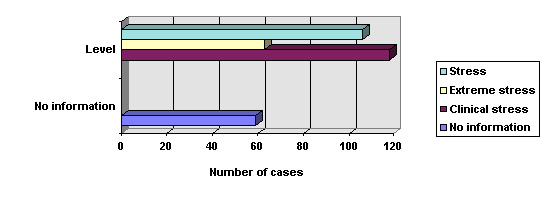
Figure 7.1 : Levels of stress
Comments : the great majority of men respondents suffered health and career problems, expressed as stress with associated problems. Given the scale of these problems, it is unusual that General Practitioners who gain first-hand accounts of these problems, and the other medical professionals, have not addressed this in terms of an epidemic.
7.2 Subsequent Attitudes
Number of responses : there were many remarks about attitudes to women and to the law. There were :
219 cases with remarks about attitudes to women
313 cases with remarks about the law.
Results : are shown for :
subsequent attitudes to women in Figure 7.2a
subsequent attitudes to the law in Figure 7.2b.

Figure 7.2a : Subsequent attitudes to women
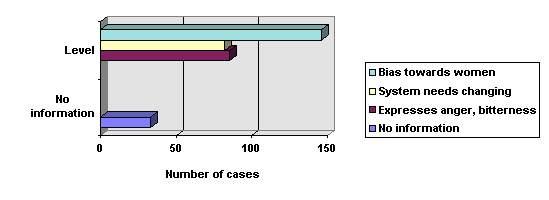
Figure 7.2b : Subsequent attitudes to the law
Quotes : about the law, many are available, of which one sums up the situation :
Totally failed me and my children.
Comments : attitudes are direct and hardened towards those agents that have caused the damage to the lives of the respondents.
7.3 Remarriage
Number of responses : of those previously married, i.e. in 307 cases, numbers who subsequently, up to the date of the survey, had remarried or cohabited are known.
Results : are shown in Figure 7.3.
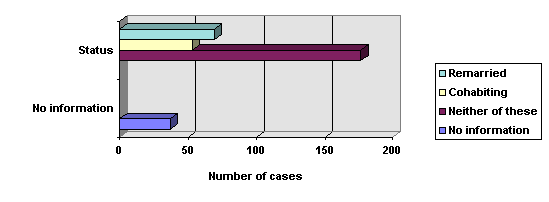
Figure 7.3 : Number who subsequently remarried or cohabited
Comments : only 19.9% are known to have remarried, and a further 15.3% were cohabiting. At least 50.1% remained single after divorce. Men were more likely to either remarry, or not to remarry, rather than cohabit.
Over 1 in 6 of FNF members responded to the survey questionnaire. The median age was 43 at the time of the survey. Most (nearly 90%) of respondents had been or were married. The median duration of the marriages was about 10 years, and the respondents had a median age of 38 years of age at the start of divorce. The average number of children was close to 2, and their median age was over 6. The respondent’s occupations could be described as ‘middle-class’, although there was a great range of different occupations.
The vast majority did not want their family to split up. None wanted to be separated from their children. Men were in most (over 70%) cases divorced by their wives, against their wishes. The grounds were predominantly unreasonable behaviour (nearly 60%) and adultery (nearly 25%). Most men denied the allegations made, and in those cases in which the man divorced the woman, few women denied the allegations. The typical time to obtain a divorce and complete the financial issues was between 1 and 2 years. Of those men petitioned against, almost 75% were not defended, mainly due to their attitudes towards the marriage, or advice from solicitors.
With regard to children’s issues, about the same number chose to contest custody as did not. Few who did succeeded. Men were more likely to achieve custody by agreement than by court order. After the cases, about 80% of women had custody of all their children. In more than 80% of cases, the man reported some obstruction to contact. Nearly 30% of fathers had lost all contact with their children, and more than 30% reported the mother as being in contempt of a court order. No mothers had been prosecuted for contempt.
On average, the man brought 5 times as much asset value into the marriage as the woman. During the marriage, the man on average earned 4 times that which the woman earned. On average the woman obtained, after the divorce, 5 times as much of the family assets as the man. The women, as a group, obtained nearly 80% of the families’ assets.
More than 50% of men paid maintenance for their children, and nearly 15% paid maintenance for their ex-wife. The median amounts were over £200 per month for the children, and over £300 per month for the ex-wives. Maintenance had a median value of about 20% of earnings. Most court order amounts were paid, while many CSA derived amounts were being challenged.
Legal costs had a median amount of about £10,000, with a range up to about £1,000,000. More women applied for legal aid, and more of those were granted it. The median financial loss to the family was about £50,000. Most homes were sold, although in those cases in which the home was not sold, the man more often stayed in that home. Women given the home nevertheless often sold it.
Almost all respondents reported malpractices in their legal proceedings, with about 20% of these identifying solicitors, about 20% identifying CWOs, and about 20% identifying judges as responsible. About 50% of CWOs did not meet the fathers with their children, and about 66% of CWO reports were regarded as unfair. The majority of CWO reports, whether fair or not, were accepted by the judge.
About 80% of men reported false allegations against them, and about 60% reported non-compliance by the woman with court orders.
The vast majority of men reported health problems, usually stress related and also affects on career. Additionally, the vast majority reported negative attitudes against women and the law, with moderate to very strong views expressed
From the ratios and percentages derived from the survey analysis, and from the Government’s statistical data for the total married population and the yearly divorce rate, we may extract some probabilities of certain outcomes in marriage. Some of these are derived directly from Government statistics and some are derived from the survey data. We have only used the survey data where we have reason to think that an extrapolation to the general population is justified.
The Government’s statistical data are taken from :
Social Trends 26, Central Statistical Office, 1996 edition, which covers the United Kingdom;
Annual Abstract of Statistics, Central Statistical Office, 1996 edition, which covers England and Wales, and Scotland.
The following data are used as a basis for the probabilities and extrapolations. They are given in rounded figures :
instances of divorce per year : 180,000. From divorce rate of 3.1 per thousand per year, in a population of 56.2 million : 1993 data taken;
instances of divorce including children per year: 124,200. Derived from the ratio of divorces involving children to all divorces, of 123,202 out of 177,805 i.e 0.69 : 1993 data taken;
rate of divorce v. marriage : 53%. From marriage and divorce rates of 5.9 and 3.1 per 1,000 population respectively, giving a ratio of 0.525 : 1993 data taken; (the commonly quoted divorce rate is 41%);
rate of woman initiated divorce : 72%. From divorces granted to women (120,000) and men (47,000), giving a ratio of women to all divorces of 0.718 : 1993 data taken;
married men : 14,000,000. From the proportion of households of married couples (61% of 22,400,000 households) : 1991 data taken;
married men with children : 7,500,000. From the proportion of households of married couples with children (33% of 22,400,000 households) : 1991 data taken.
The probability of specified outcomes are calculated where ‘P(outcome)’ is the probability of that outcome occurring to a man chosen at random from the population. The probabilities are then used to calculate the number of occurrences of that outcome in general.
| Outcomes : occurring to a married man during marriage Population : all currently married men |
P(outcome) |
Occurrences to currently married men |
| be divorced | 0.53 |
7,355,900 |
| be divorced by his wife using fabricated grounds | 0.24 |
3,338,800 |
| lose custody of his child(ren) | 0.24 |
3,417,800 |
| lose custody, and never see child(ren) again | 0.08 |
1,069,600 |
| lose his home | 0.39 |
5,516,900 |
| lose a significant proportion of his life savings | 0.49 |
6,923,200 |
It is possible to estimate the probability that a married parent will raise his or her own children, in a normal family setting, to adulthood. We have 47% of parents who raise their children within the usual two-parent family. For the other 53% who divorce, we know from the survey statistics that about 86% of mothers and only 9% of fathers will continue to have custody of all children. Taking 86% and 9% of the 53% who divorce, we obtain data about those divorced couples, that 46% of women and 5% of men retain custody. Adding these figures to 47% we obtain the figures that 93% of mothers and 52% of fathers will be primary carers responsible for raising their own children to adulthood. The probability that a married mother will remain a primary carer of her own children is therefore 0.93, but for a father the figure is 0.52.
Duncan Dormor of the charity "One plus One" stated in their publication The Relationship Revolution 1992 :
In countries with high rates of relationship dissolution a substantial proportion of children will be brought up by their mothers alone for much of their childhood. If this trend continues the only continuing relationship a child may have will be with its mother … at present 90% of single parent households are headed by women. This means that very few of the children of divorced parents are likely to have immediate and ongoing contact with their fathers.
The consequences of this are that we shall have brought about a state engineered matrilineal society. The impact that this will have on social cohesion is unpredictable but is likely to be very damaging. The survey data that we have reported here do nothing to alleviate this fear.
Questionnaire StructureQuestionnaire Page 1
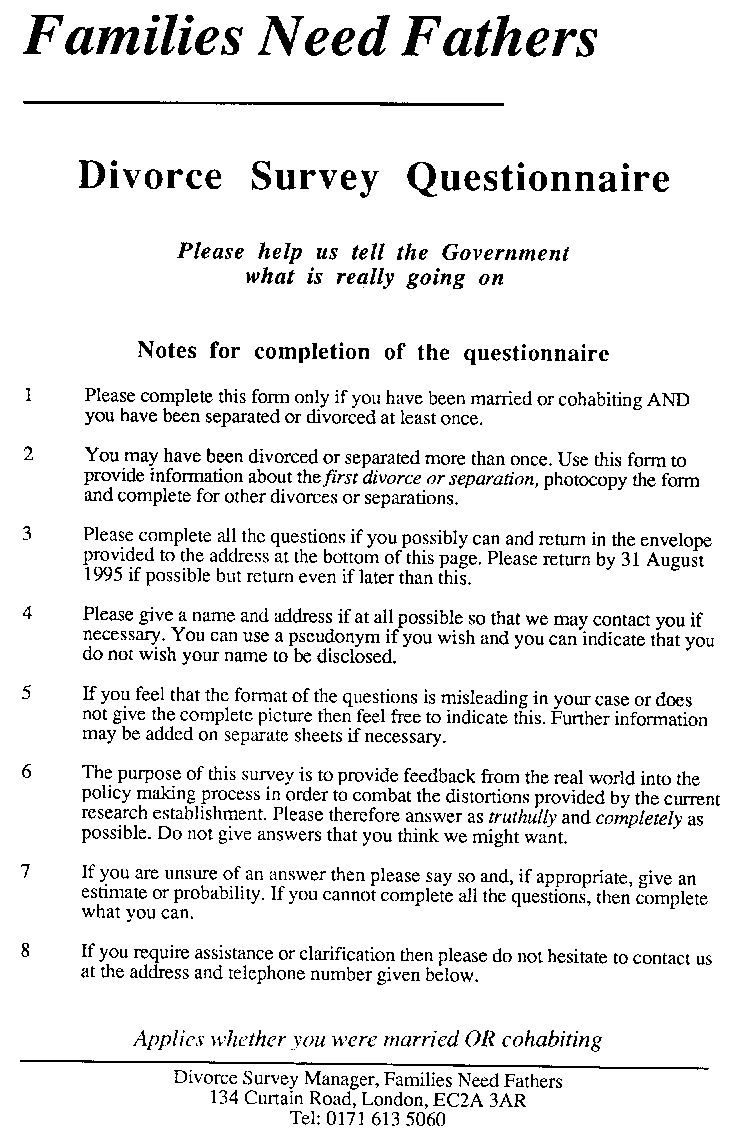
Questionnaire Page 2

Questionnaire Page 3
Questionnaire Page 4

Questionnaire Page 5
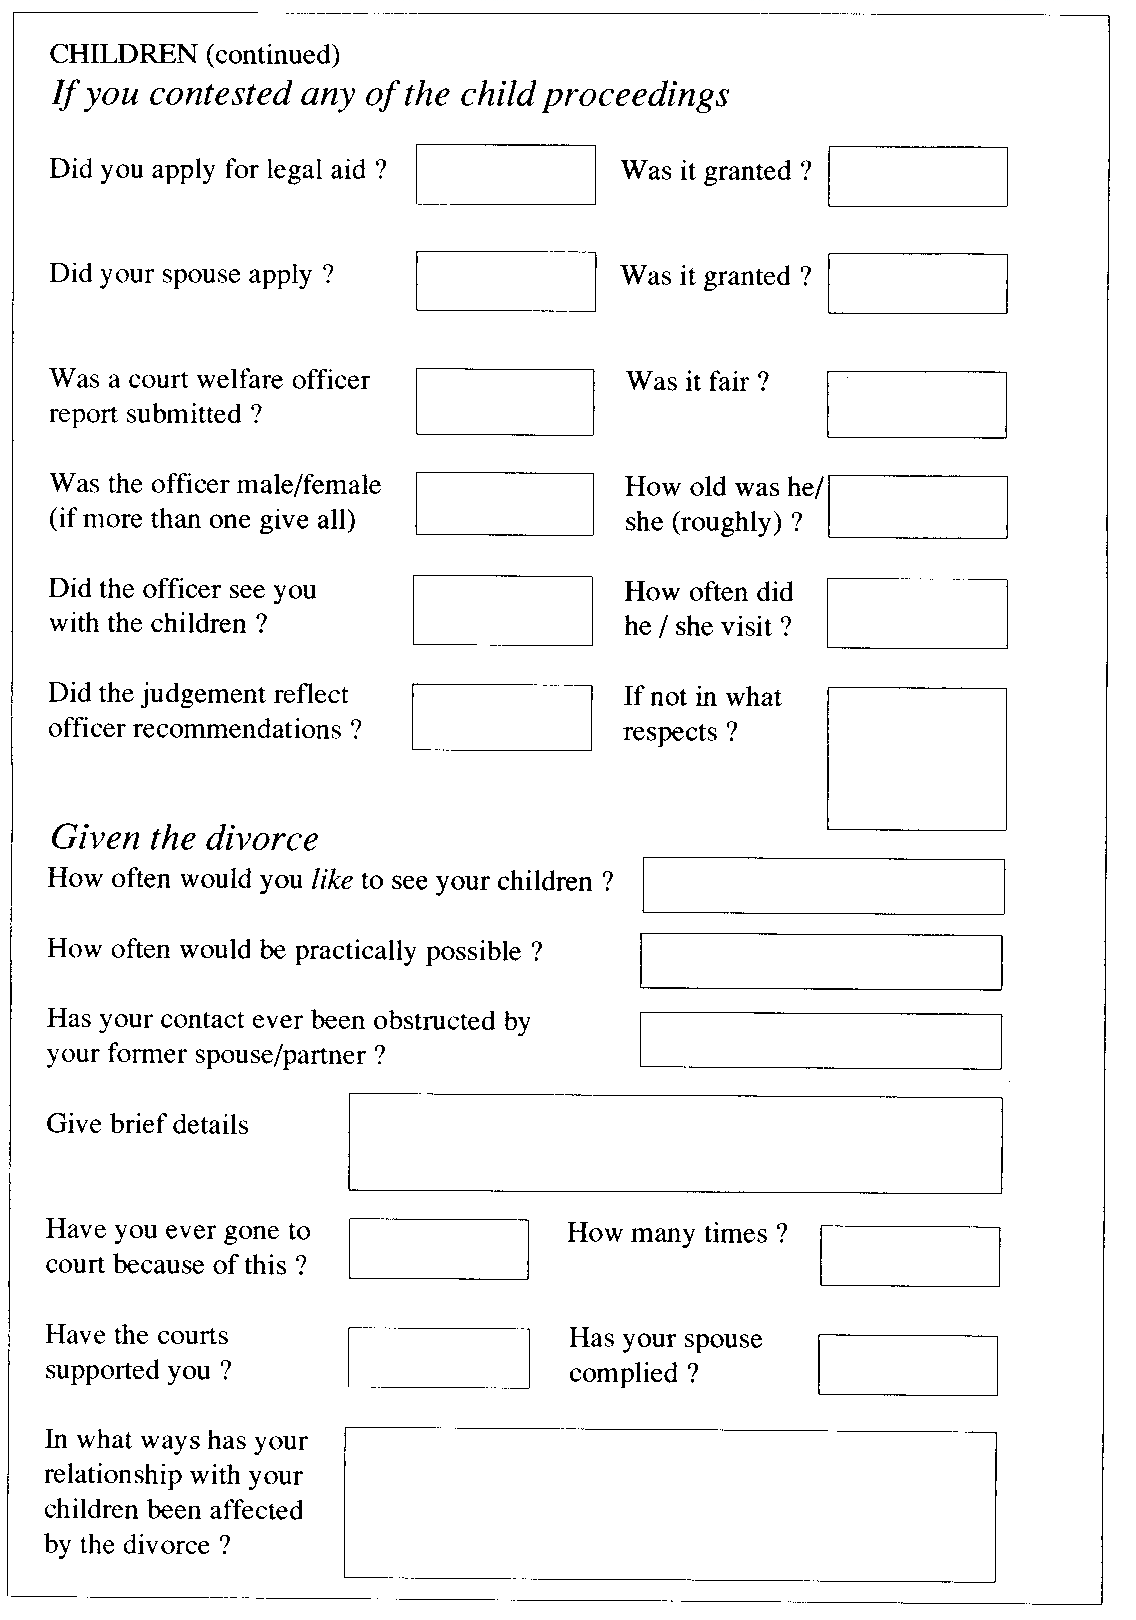
Questionnaire Page 6
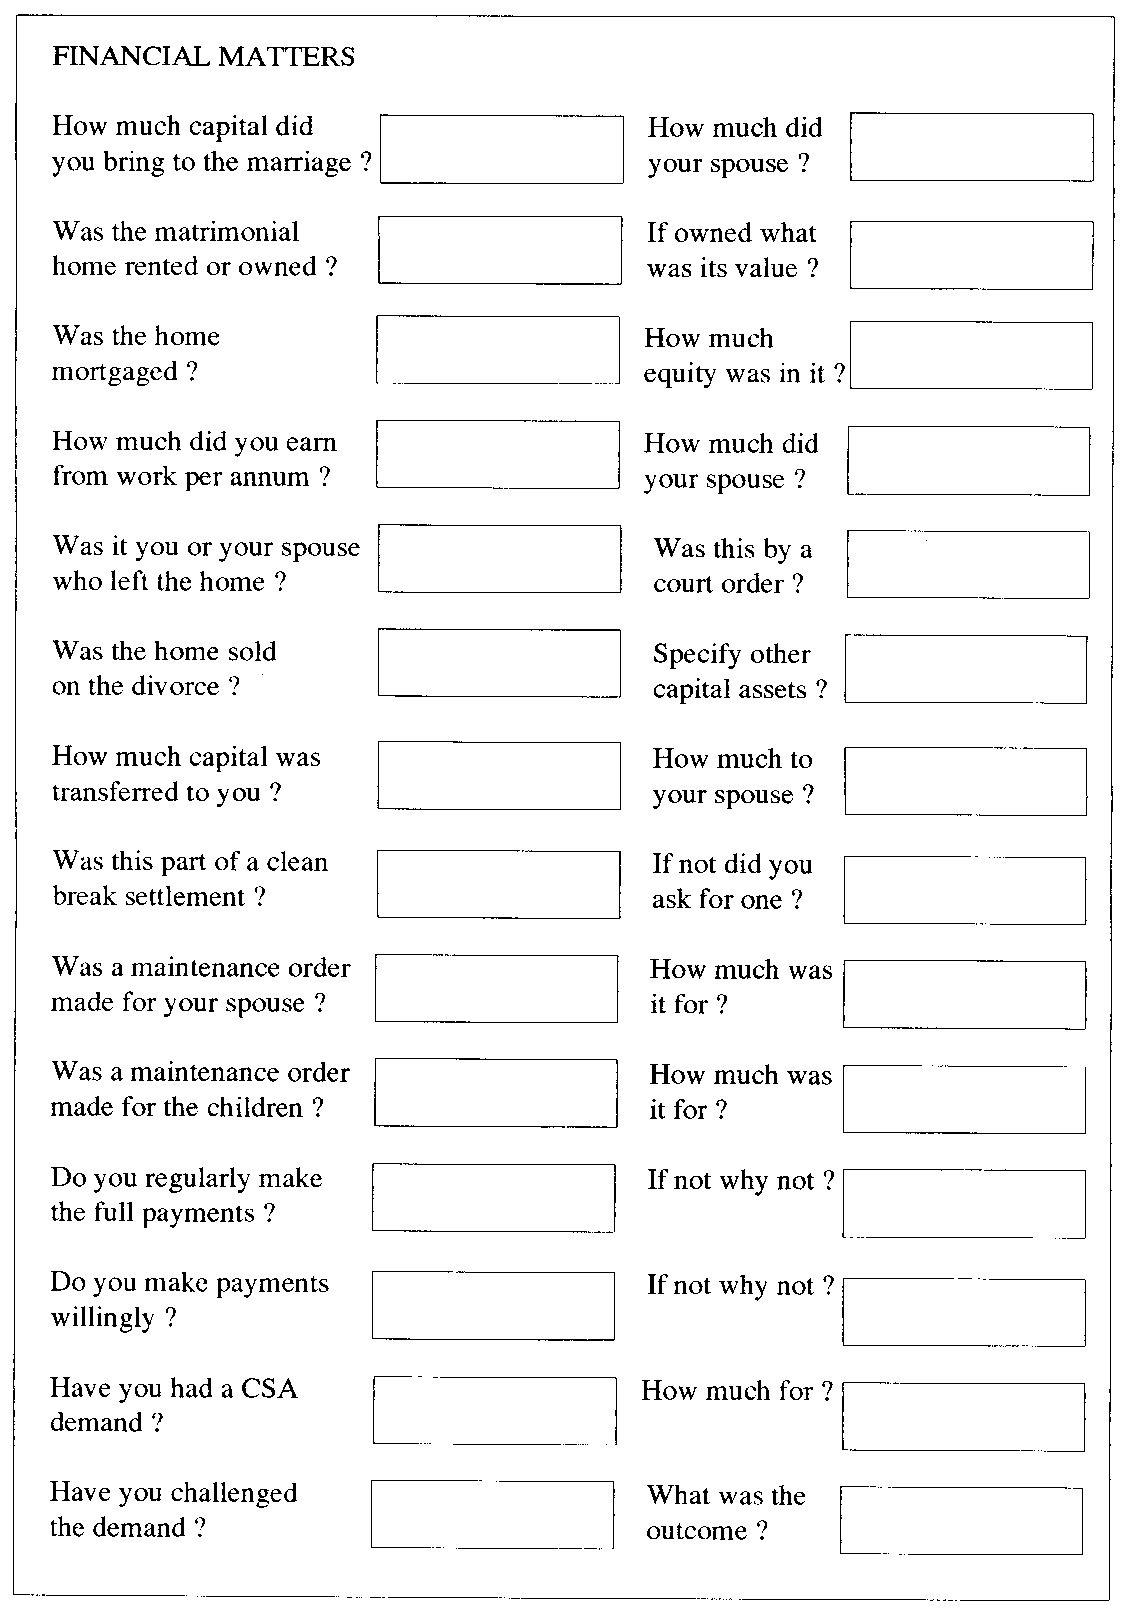
Questionnaire Page 7
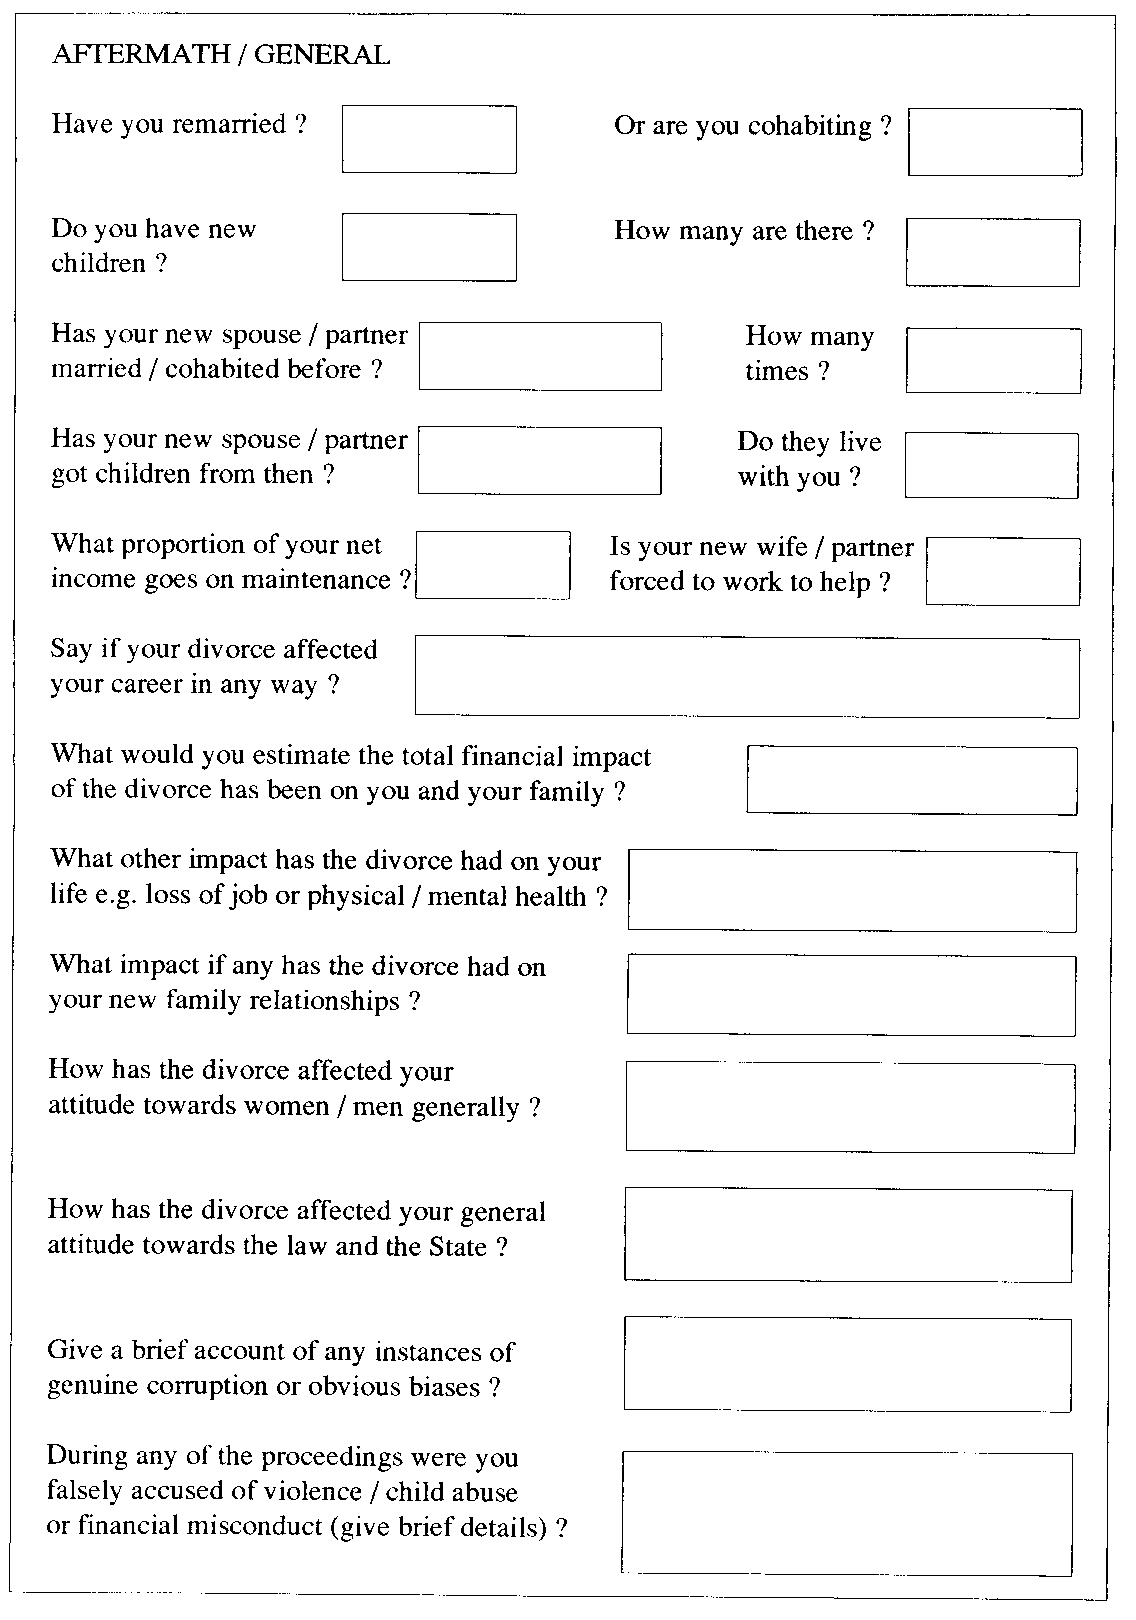
Questionnaire Page 8

Occupations of Respondents
Title Subgroup |
Number | Title Subgroup | Number |
Director |
15 |
Finance: |
4 |
| Town Planner | 2 | - Adviser | 3 |
| Musician | 2 | - Banking | 3 |
| Consultant: | 2 | - Stockbroker | 1 |
| - Surgeon | 2 | Accident Investigater | 1 |
| - Engineer | 1 | Nurseryman | 1 |
| - Computer | 1 | Forester | 1 |
| - Tax | 1 | Designer | 1 |
| - Systems | 1 | Librarian | 2 |
| - Management | 3 | Customs & Excise | 1 |
| Doctor | 11 | Storekeeper | 1 |
| Lecturer | 17 | Video Producer | 1 |
| Pilot | 2 | Driving Instructor | 1 |
| Nurse | 4 | Entertainer | 1 |
| Teacher | 15 | Stock Controller | 1 |
| Teacher's Aide | 1 | Prison Officer | 1 |
| Architect: | 2 | Safety Officer | 1 |
| - Landscape | 1 | Inspector: | 1 |
| Actor | 1 | - Electrical | 1 |
| Education Adviser | 1 | - Gaming | 1 |
| Packer | 1 | Sales Executive | 1 |
| Photographer | 2 | Chief Executive | 2 |
| Private Income | 1 | Computer: | |
| Civil Servant | 6 | - Planner | 1 |
| Pension Administrator | 1 | - Analyst | 1 |
| Engineer: | 12 | - Contractor | 1 |
| - Commissioning | 1 | - Auditor | 1 |
| - Chartered | 3 | - Engineer | 2 |
| - Quality Assurance | 1 | - Software Engineer | 1 |
| - Civil | 6 | - Programmer | 2 |
| - Research | 1 | - Help Desk Supervisor | 1 |
| - Mine | 1 | Security Surveyor | 1 |
| - Heating | 1 | H.M.Forces | 2 |
| - Aero | 2 | Paint Sprayer | 1 |
| Machine Operator | 1 | Researcher: | 1 |
| Systems Analyst | 3 | - Tourist Guide | 1 |
| Residential Home Owner | 1 | Publishing Manager | 1 |
| Manager: | 8 | Bloodstock Agent | 1 |
| - Retail | 3 | Draughtsman | 1 |
| - Electrical Engineering | 1 | Tea Merchant | 1 |
| - Customer Services | 1 | Printer | 1 |
| - Works | 1 | Glassblower | 1 |
| - Programme | 1 | Student | 4 |
| - Shipping | 2 | Industrial Relations Officer | 1 |
| - Landscape | 1 | Electrician | 3 |
| - Personnel | 1 | Security Officer | 1 |
| - Community services | 1 | Salesman | 4 |
| - Sales/Marketing | 4 | Mechanic | 1 |
| - Project | 2 | Fitter (Motor) | 1 |
| - Operations (Gas) | 1 | Firefighter | 1 |
| - Bank | 1 | Shop Owner | 4 |
| - CAD systems | 1 | Decorator | 1 |
| Sub Postmaster | 1 | Shop Assistant | 3 |
| P.O.Admin.Clerk | 1 | Self Employed | 13 |
| Policeman | 4 | Solicitor | 6 |
| Advice worker | 1 | Flight Crew | 1 |
| Cameraman | 1 | Education Executive | 1 |
| Accounts Controller | 1 | House Father | 2 |
| Social Worker | 2 | Accountant: | 7 |
| Dentist | 2 | - Chartered | 4 |
| Merchant Seaman | 1 | Railtrack Manager | 1 |
| R.M.N. | 1 | Barrister | 1 |
| Carpenter | 2 | TV Journalist | 1 |
| Chef | 1 | TV News Engineer | 1 |
| Builder | 1 | Writer | 2 |
| Transport Economist | 1 | Registrar | 1 |
| Drycleaner | 1 | Porter | 2 |
| Cargo Handler | 1 | Safety Officer | 1 |
| H.G.V. Driver | 3 | Unemployed | 14 |
| Van Driver | 1 | Deceased (!) | 1 |
| Farmer | 1 | Retired | 1 |
| Day Case Officer | 1 | Missionary | 1 |
| Linguist | 1 | ||
| Insurance | 2 |
Supplement : Summary, Probabilities and Extrapolations, and Conclusions
CONTENTS
S2 Probabilities and Extrapolations
The survey of members of Families Need Fathers (FNF), of Summer 1995, has been analysed by the Cheltenham Group (CG), and the results published in The Impact of Divorce Law Practice on Fathers and Children - The Main Findings, of July 1996.
This Supplement has also been produced by the CG, and extends the analysis of the data. The results are further analysed to provide :
statistical probabilities of the outcomes of marriage, fatherhood and divorce, based on the survey results;
and, using Government statistical data from censuses etc., some extrapolations of these probabilities on the population of married men.
The survey was conducted by questionnaire, of the total FNF membership of approximately 2,000. Replies were received from 346 members i.e. more than 1 in 6. The probabilities and extrapolations are based on the premise that the total population of divorced fathers have experienced similar outcomes. It may be the case that a response from 1 in 6 of FNF members is not fully representative. However, additional anecdotal evidence from local contacts exists that many fathers, with similar and worse outcomes, never join FNF. Only about 1 in 10 of divorced fathers, who approach the local contacts, later join FNF.
The probabilities and extrapolations are therefore estimates which provide the best available measure of these outcomes, and which indicate the order of magnitude.
These further analyses are prefaced with a copy of the summary from The Main Findings, and supported with some conclusions. This Supplement therefore provides in concise form, all of the main results from the survey.
Those wishing to reproduce the results are asked to acknowledge the source as The Impact of Divorce Law Practice on Fathers and Children - Supplement : Summary, Probabilities and Extrapolations, and Conclusions, of July 1996.
Over 1 in 6 of FNF members responded to the survey questionnaire. The median age was 43 at the time of the survey. Most (nearly 90%) of respondents had been or were married. The median duration of the marriages was about 10 years, and the respondents had a median age of 38 years of age at the start of divorce. The average number of children was close to 2, and their median age was over 6. The respondent’s occupations could be described as ‘middle-class’, although there was a great range of different occupations.
The vast majority did not want their family to split up. None wanted to be separated from their children. Men were in most (over 70%) cases divorced by their wives, against their wishes. The grounds were predominantly unreasonable behaviour (nearly 60%) and adultery (nearly 25%). Most men denied the allegations made, and in those cases in which the man divorced the woman, few women denied the allegations. The typical time to obtain a divorce and complete the financial issues was between 1 and 2 years. Of those men petitioned against, almost 75% were not defended, mainly due to their attitudes towards the marriage, or advice from solicitors.
With regard to children’s issues, about the same number chose to contest custody as did not. Few who did succeeded. Men were more likely to achieve custody by agreement than by court order. After the cases, about 80% of women had custody of all their children. In more than 80% of cases, the man reported some obstruction to contact. Nearly 30% of fathers had lost all contact with their children, and more than 30% reported the mother as being in contempt of a court order. No mothers had been prosecuted for contempt.
On average, the man brought 5 times as much asset value into the marriage as the woman. During the marriage, the man on average earned 4 times that which the woman earned. On average the woman obtained, after the divorce, 5 times as much of the family assets as the man. The women, as a group, obtained nearly 80% of the families’ assets.
More than 50% of men paid maintenance for their children, and nearly 15% paid maintenance for their ex-wife. The median amounts were over £200 per month for the children, and over £300 per month for the ex-wives. Maintenance had a median value of about 20% of earnings. Most court order amounts were paid, while many CSA derived amounts were being challenged.
Legal costs had a median amount of about £10,000, with a range up to about £1,000,000. More women applied for legal aid, and more of those were granted it. The median financial loss to the family was about £50,000. Most homes were sold, although in those cases in which the home was not sold, the man more often stayed in that home. Women given the home nevertheless often sold it.
Almost all respondents reported malpractices in their legal proceedings, with about 20% of these identifying solicitors, about 20% identifying CWOs, and about 20% identifying judges as responsible. About 50% of CWOs did not meet the fathers with their children, and about 66% of CWO reports were regarded as unfair. The majority of CWO reports, whether fair or not, were accepted by the judge.
About 80% of men reported false allegations against them, and about 60% reported non-compliance by the woman with court orders.
The vast majority of men reported health problems, usually stress related and also affects on career. Additionally, the vast majority reported negative attitudes against women and the law, with moderate to very strong views expressed.
S2 Probabilities and Extrapolations
From the ratios and percentages derived from the survey analysis, and from the Government’s statistical data for the total married population and the yearly divorce rate, we may extract some probabilities of certain outcomes in marriage. Some of these are derived directly from Government statistics and some are derived from the survey data. We have only used the survey data where we have reason to think that an extrapolation to the general population is justified.
The Government’s statistical data are taken from :
Social Trends 26, Central Statistical Office, 1996 edition, which covers the United Kingdom;
Annual Abstract of Statistics, Central Statistical Office, 1996 edition, which covers England and Wales, and Scotland.
The following data are used as a basis for the probabilities and extrapolations. They are given in rounded figures :
instances of divorce per year : 180,000. From divorce rate of 3.1 per thousand per year, in a population of 56.2 million : 1993 data taken;
instances of divorce including children per year: 124,200. Derived from the ratio of divorces involving children to all divorces, of 123,202 out of 177,805 i.e 0.69 : 1993 data taken;
rate of divorce v. marriage : 53%. From marriage and divorce rates of 5.9 and 3.1 per 1,000 population respectively, giving a ratio of 0.525 : 1993 data taken; (the commonly quoted divorce rate is 41%);
rate of woman initiated divorce : 72%. From divorces granted to women (120,000) and men (47,000), giving a ratio of women to all divorces of 0.718 : 1993 data taken;
married men : 14,000,000. From the proportion of households of married couples (61% of 22,400,000 households) : 1991 data taken;
married men with children : 7,500,000. From the proportion of households of married couples with children (33% of 22,400,000 households) : 1991 data taken.
Outcomes in marriage and divorce
Specific outcomes are identified which may occur in marriage, and which may occur during or after divorce. For the statistics, the populations chosen are :
all currently married men,
those men undergoing divorce in 1 year.
The probability of the specified outcomes, i.e. ‘P(outcome)’, is the probability of that outcome occurring to a man chosen at random from the population. The probabilities are then used to calculate the number of occurrences of that outcome in the population.
| Outcomes : occurring to a married man during marriage Population : all currently married men |
P(outcome) |
Occurrences to currently married men |
| be divorced | 0.53 |
7,355,900 |
| be divorced by his wife using fabricated grounds | 0.24 |
3,338,800 |
| lose custody of his child(ren) | 0.24 |
3,417,800 |
| lose custody, and never see child(ren) again | 0.08 |
1,069,600 |
| lose his home | 0.39 |
5,516,900 |
| lose a significant proportion of his life savings | 0.49 |
6,923,200 |
| Outcomes : occurring to a married man during divorce Population : men divorced in 1 year |
P(outcome) |
Occurrences to married men per year |
| have no effective defence to a wife’s petition | 0.61 |
110,000 |
| not receive legal aid | 0.64 |
115,000 |
| have false allegations made against him | 0.58 |
105,000 |
| be the victim of malpractices in his legal case | 0.87 |
156,000 |
| Outcomes : occurring to a married man after divorce Population : men divorced in 1 year |
P(outcome) |
Occurrences to divorced men per year |
| suffer obstruction to contact with his children | 0.61 |
109,800 |
| suffers stress | 0.83 |
149,300 |
| will not remarry | 0.77 |
138,300 |
| have attitudes to women in general | 0.63 |
113,900 |
| have attitudes to the law | 0.90 |
162,800 |
Financial outcomes
For assets, legal costs and maintenance it is possible to identify items of funding and to extrapolate the total funds for these items per year. All data for this are given as averages. Totals are based on 180,000 divorces per year.
The amounts transferred to women are based on the premise that assets are shared equally after marriage, and should be shared equally after divorce.
| Item : of assets and legal costs at marriage and divorce Value : given in £s |
Average per case |
Total per year |
| transferred to women at marriage | 9,913 |
1,748,250,000 |
| transferred to women at divorce | 18,804 |
3,384,720,000 |
| paid to lawyers at divorce (men only data) | 29,306 |
5,275,080,000 |
As maintenance is made on an on-going yearly basis, for a number of years, it is possible to provide both yearly and total data. The median and average ages of children at start of divorce proceedings are 6 and 7 years respectively, and maintenance for children is payable until the children are 18 or leave education : a typical length of time over which maintenance is made is therefore about 10 years, and this is therefore used. That is, the totals represent how much will be made over the following 10 year period. The total for all cases is that for those cases arising from divorce in a 1 year period. To provide for this, data is given :
per case per year,
total per case,
total for all applicable divorce cases occurring in 1 year.
Maintenance for children is liable only in those cases of divorce involving children (i.e. 69% based on Government data), and is reported as being actually paid in 68.9% of survey cases. The proportion of cases of divorce in which child maintenance is paid is therefore estimated at 0.69 * 0.689 = 0.476, i.e. 47.6%. The proportion of cases for which ex-wife maintenance is paid is 13.4% of survey cases.
The percentage indicates the proportion of all divorce cases, i.e. out of the 180,000 divorces per year, to which the item applies.
| Item : of maintenance after divorce Value : given in £s |
Average per case per year |
Total per case (made over 10 years) |
%age of cases to which this applies |
Total for cases in 1 year (made over 10 years) |
| maintenance for children | 3,216 |
32,160 |
47.6 |
2,752,053,300 |
| maintenance for (ex-)wives | 5,292 |
52,920 |
13.4 |
1,276,430,400 |
Children
It is possible to estimate the probability that a married parent will raise his or her own children, in a normal family setting, to adulthood. We have 47% of parents who raise their children within the usual two-parent family. For the other 53% who divorce, we know from the survey statistics that about 86% of mothers and only 9% of fathers will continue to have custody of all children. Taking 86% and 9% of the 53% who divorce, we obtain data about those divorced couples, that 46% of women and 5% of men retain custody. Adding these figures to 47% we obtain the figures that 93% of mothers and 52% of fathers will be primary carers responsible for raising their own children to adulthood. The probability that a married mother will remain a primary carer of her own children is therefore 0.93, but for a father the figure is 0.52.
Finances
It is also possible to estimate the average financial transfer from a man to a woman in the process of marriage and divorce involving children. Taking the data per case, we have £9,913 at marriage, £18,804 at divorce, £17,206 for the children (although 69% of divorces involve children only some 68.9% of these make child maintenance) over 10 years, and £7,091 for the (ex-)wife (on the basis of the 13.4% who have this maintenance) over 10 years. The total is £53,014 per case of marriage and divorce involving children.
The amount paid by men to lawyers is £29,306 per case of marriage and divorce. This is an average figure, for those with children.
A comparison
The proportion of marriages which result in children but end in divorce is over 50%. In cases of divorce involving children, the woman is almost certain to raise her own children to adulthood, and the man is almost certain to lose his children; also the woman will gain on average £53,014 of unearned funds, and the man will lose the same.
Expressed in simple lay terms, if a man takes the step of marrying and has children there is :
a 50/50 chance that it will result in him losing his children,
a 25/75 chance of losing his home,
and a 50/50 chance it will cost him about £82,320 (comprised of £53,014 to his ex-wife and £29,306 to lawyers).
If a woman takes the step of marrying and has children :
it is almost a certainty she will keep her children,
she will also have a 25/75 chance of losing her home,
and a 50/50 chance she will benefit by about £33,014 (comprised of £53,014 from her ex-husband but of which about £20,000 goes to lawyers).
Government monitoring
The Lord Chancellor’s (LC’s) Department has never produced any comparable data to that presented in this analysis. The conclusion to be drawn from this is that the LC’s Department is not aware of what is taking place behind the closed doors of the secret court proceedings in the matrimonial law courts. The further conclusion is that no one else in the UK knows what is going on.
The implications of this simple fact is that these matters in our society are almost entirely unmonitored by the public or Parliament. They must therefore be, and as we observe are, out of the control of the Government and Parliament.
Further investigations necessary
The data and analysis on malpractices has been limited by that available in the survey. Further investigation is recommended to uncover the extant to which the components in the legal system are not operating as intended, and the extent to which Parliament’s intentions are not being met. Individual cases require investigation, as well as the scale of these problems in the population of fathers who have had recourse to law in order to protect themselves and their children.
A significant amount of useful information has not been collected in the survey. This is due to a significant proportion of respondents who did not complete the questionnaire as diligently as they could have. Our analysis includes such responses under ‘no information’. These respondents, in answering specific questions, did not give direct information, but referred to the free text ‘narrative’ section for more information. It has not been possible to extract answers to specific questions from this narrative, and so some topics in the analysis may understate the reality of the situation. A more comprehensive survey, and of a greater sample of the population, would provide greater accuracy and reliability.
Fallacies
The data summarised in section S2 demonstrates conclusively that the public holds fallacies about the divorce process and its consequences. The fiction of the deserting adulterous husband who mistreats his ex-wife, and of the wife who needs protection, could not be further from the reality of the situation in the great majority of cases.
Parliament’s intentions
The data also demonstrates that the intentions of Parliament in matrimonial statutes are currently largely ignored This is due to judicial corruption of statute on fundamental principles, as well as malpractices by legal practitioners in matrimonial law cases.
Social consequences
Duncan Dormor of the charity "One plus One" stated in their publication The Relationship Revolution 1992 :
In countries with high rates of relationship dissolution a substantial proportion of children will be brought up by their mothers alone for much of their childhood. If this trend continues the only continuing relationship a child may have will be with its mother … at present 90% of single parent households are headed by women. This means that very few of the children of divorced parents are likely to have immediate and ongoing contact with their fathers.
The consequences of this are that we shall have brought about a state engineered matrilineal society. The impact that this will have on social cohesion is unpredictable but is likely to be very damaging. The survey data that we have reported here do nothing to alleviate this fear.